CEBS Data Model
From XBRLWiki
(diff) ←Older revision | Current revision | Newer revision→ (diff)

Contribution dated 2009-11-03
ALL TOPICS ARE STILL ON DISCUSSION!
Contents |
Abstract
This document should help users of the CEBS taxonomie (COREP and FINREP) to understand the Matrix Schemas published on www.eurfiling.info web site. In the following the basic aspects of the mulitdimensional data models are explained.
Multidimensional terminology
Description
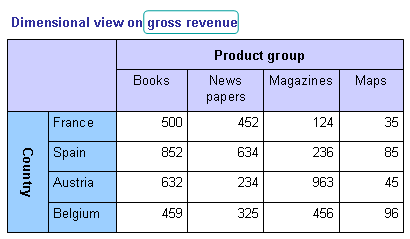
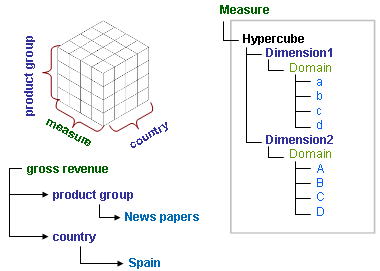
Most of the data presented in tables can be divided in different categories or rather breakdowns. In the table below the gross revenue is broken down by product group and country. The information contained is far more detailed as showing only the aggregated sum of gross revenue and allows therefore a more comprehensive analysis. Multidimensionality is widely used for cost accounting and the corresponding supervision.
The table shows a two dimensional view on the data but in fact three dimensions are included.
Measures
The data that is analysed often in aggregations are called maeasures because they are (mostly) numeric values and measureable. Having only gross revenue and a value is not enough to interpret the data so they are analysed by using "by" conditions. Those "by" conditions are reflected in the example above "by" product group and "by" country.
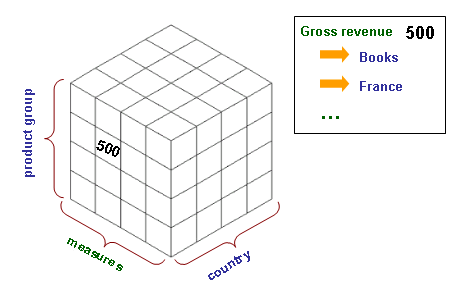
Multidimensional data is often shown as three dimensional cube. The restriction on three dimensions is based on the limitations of the graphical representation.
A cell in the cube corresponds to a cell in the table.
Dimensions
"By" conditions are called dimensions. Dimensions are views for which data should be stored and they can vary depending on the underlying framework. Some dimensions can be seen as general like time or measure unit.
In the example above the country represents a list of possible countries but other dimensions also representing countries could be "country of origin" or "buying country".
Domain
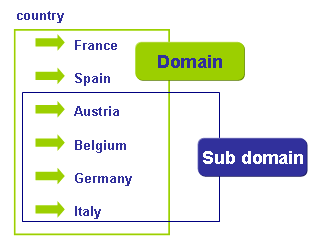
A domain is a set of items having a specific coherence. This domain can be assigned to a dimension. A sub domain is a subset of items of a domain. A sub domain can also be assigned to a dimension, ie. European countries.
In the CEBS framework domains consists of all possible breakdown items like exposure classes or counterparties. If one table does not include all the possible items and using only a shortened list, a sub domain is created.
Domain member
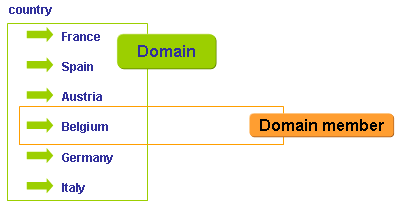
One item in the data set representing a domain is called domain member. In a CEBS taxonomy they are built up in a domain-member-ship.
Each combination of a measure with the according dimension - domain member combinations identifies a data set uniquely.
Hypercube
A hypercube defines the cartesian product of the combinations of measures and dimensions. Hypercubes can be assigned to measures. A grahical representation of a hypercube in an XBRL taxonomy is shown below. The dimension members are attached to a domain. The domains are attached to a dimension and the dimensions are assigned to a hypercube.
Depending on the position of the measure in the hierarchy (domain-member-ship) a hypercube can be defined for cells, group of cells or a complete cube (table).
Section
In this case the example table has been extended by an additional breakdown of book category.
The table can be devided in different parts which are characterised by different number of breakdowns. Both tables refer to the same measure but the first one consists of two dimensions and the second one of three.
Matrix Schema readme
FINREP Matrix Schema 2.0
This is the working area for Data Model and Matrix Schemas. The original documents are stored at Eurofiling Google Group
